Advertising pressure in May: Food industry ignites the advertising turbo
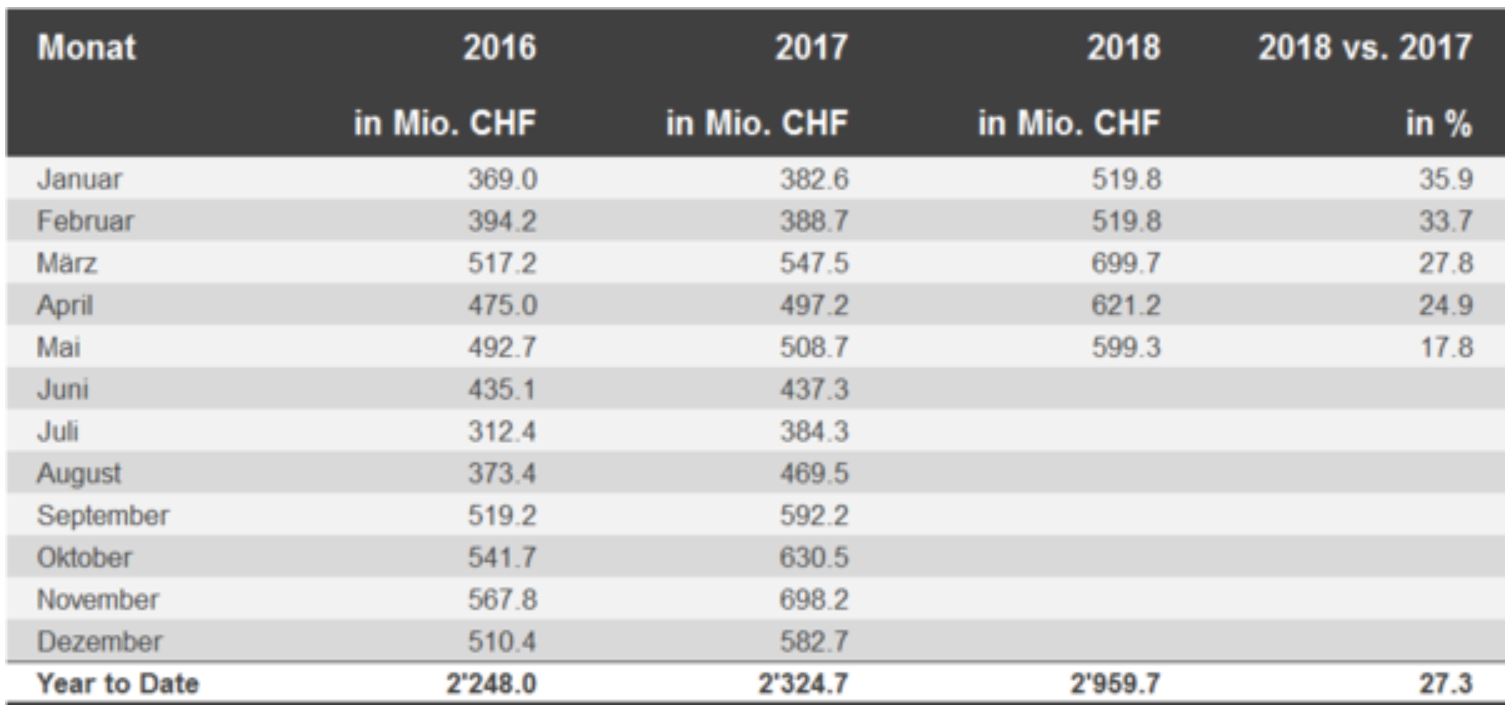
Advertising print also showed a downward trend in May. With advertising print of 599.3 million gross Swiss francs, May shows a decline of 3.5 percent compared with the previous month. The food industry, however, increased its advertising print by 10 percent in May.


Compared with the same month last year, advertising print is 17.8 percent higher, although this is driven by the online data expansion. Without this, advertising print is down 4 percent in May. However, if we look at the advertising print for the year to date, the trend - whether with or without data expansion - continues to be upward (27.3 percent and 2.2 percent respectively).
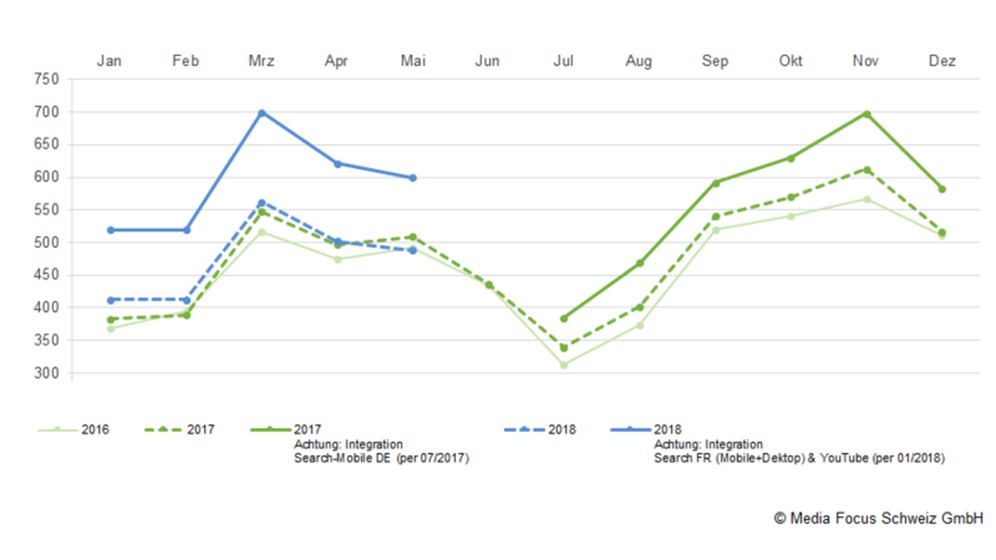
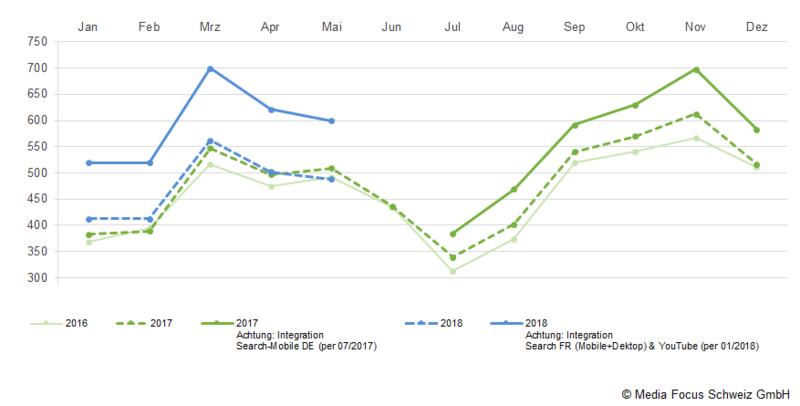
Advertising pressure in the overall market
Development of advertising print as of May 2018
Food industry ignites the advertising turbo
Five of the top 10 industries reduce their advertising pressure compared with the previous month. Leading the way are Construction, Industry & Furnishings (-23%), Digital & Household (-19%) and Fashion & Sports (-10%). The food industry, on the other hand, increases its advertising print by 10 percent in the same period and climbs to fifth place in the ranking. At 54.2 million gross Swiss francs, the industry achieves the highest advertising print in the month of May, despite a significant reduction compared to the previous year (-8%). Finance (+7%), also manages to make up one place. Both position changes are at the expense of the automotive sector.
Service industry high unstoppable
In a year-on-year comparison, it is once again the service sector that achieves the greatest increase (+76.1%). This is followed by Leisure, Catering and Tourism (+62.3%) and Cleaning (+61.6%).
Looking at the summer, the highest percentage increase compared to April (+18.7%) can be observed for the beverage sector. In absolute figures, this is still 4.3 million Swiss francs. The increase is only higher in the product groups Political Campaigns (+74.9%), TV & Home Entertainment (42.7%) and Passenger Cars (new) (22.7%).
Smoke signals fade
Five industries fail to match the previous year's advertising pressure. Tobacco products recorded the highest year-on-year decline in May 2018 (-72.1%), followed by Political Campaigns (-26.6%), Media (-24.1%), Cosmetics & Personal Care (-12%) and Beverages (-8%).
Advertising printing in the industries
Advertising pressure in the sectors with year-on-year comparison

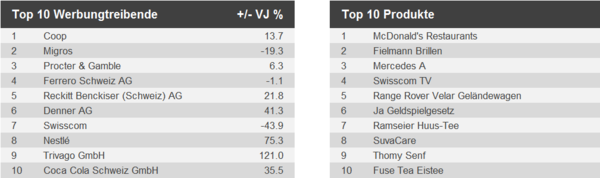
Top 10 of the month
Top advertisers and most advertised products and services (excluding product range and image advertising) in May
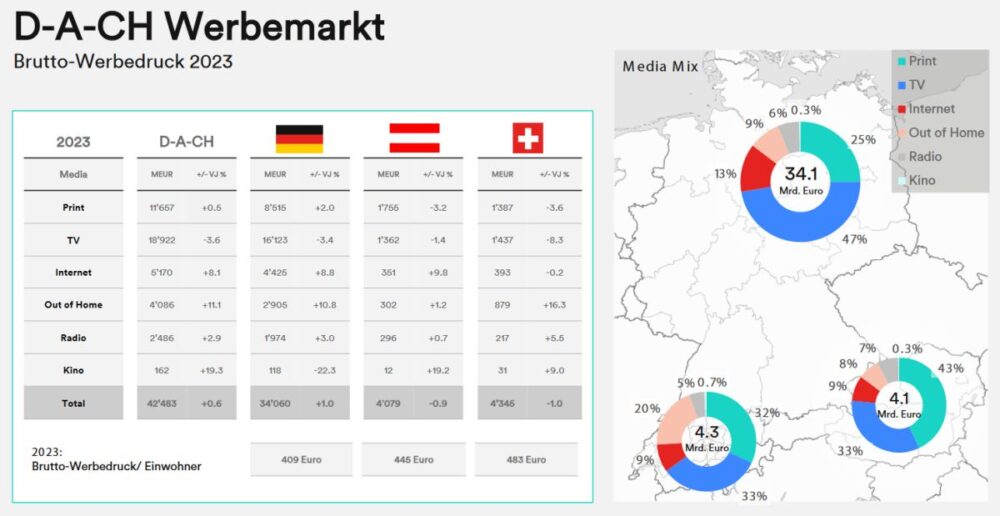
Media Mix
The integration of Search data, Desktop (January 2017) and Mobile (July 2017) into the Media Focus advertising statistics has led to a significant increase in the share of Internet in the media mix. Since January 2018, Search data has also been collected for French-speaking Switzerland (Search share: 87% DE/13% FR).
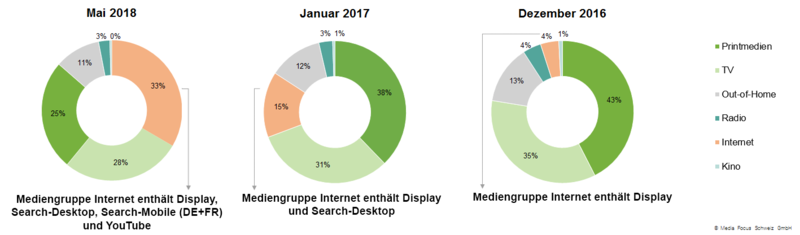
Data integration: Internet and TV
Since January 2017, the Internet media group has been reported in the Trend advertising market, including Search Desktop advertising. As of the end of July 2017, Search-Mobile was also integrated into the advertising statistics of Media Focus. In January 2018, Search was integrated for French-speaking Switzerland on the basis of tens of thousands of French search terms (share of Search YTD: 87% DE/13% FR).
Since March 2018, YouTube data (display and video) has also been reported retroactively from January 2018 in the advertising market trend (share of media mix YTD 1%). In addition, since January 2018, the TV media group has included TV sponsorship and the advertising formats pre-split, post-split, single split and time.