Media professionals are often wrong in their assessment of media use
A study by Goldbach Media, IGEM and Wemf examines the media usage of marketing and media professionals compared to the general population. The study aims to show the "ad people", using concrete figures, whether their assumptions about general media use differ from the actual use of the population, and to what extent they use the media differently.


 In August and September 2021, Goldbach Media and the electronic media interest group IGEM conducted the study "Media Bias: Media Use of Marketing and Media Professionals Compared to the Swiss Population" with over 650 media professionals - referred to in the study as "Ad People". Participants were asked about their media usage behavior as well as their assumptions about general media usage. The questions on electronic media were taken from the IGEM Digimonitor questionnaire, so that there was comparability with the survey of media use by the population as a whole. For print usage, the MA Strategy was chosen as the comparative study.
The study is intended to show whether and to what extent the media usage behavior of ad people and their assumptions about general media usage differ from the actual usage of the population. This is intended to start a discourse in the industry in order to become aware of the possibly distorted perception and its consequences in media planning.
Estimates off by 10 percentage points on average
As the study shows, the media usage behavior of ad people differs in part significantly from that of the overall population, with ad people using media more on average. While both groups make very heavy use of traditional media - print, TV & radio - the newer media - streaming services, social media, messenger services and others - are used much more by ad people.
However, the usage behavior of ad people differs depending on age, professional experience and hierarchical level. The greater the professional experience and the higher the hierarchical level, the greater their use of classic media - the exact opposite is true for most newer media.
The key finding of the study is that ad people are off by an average of 10 percentage points in their assessment of the media usage of the population as a whole: Underestimating traditional media and overestimating newer media. These results should underline the importance of conducting media usage research and using the data for marketing decisions.
The most important results and findings
Other usage patterns lead to distorted estimates, whereby classic media tend to be underestimated and newer media tend to be overestimated. This makes it all the more important that decisions in media planning are fact-based, drawing on research data.
- When estimating usage, the ad people are off by around 10 percentage points on average across all media offerings. There are significant differences depending on the medium. For example, the use of traditional media tends to be underestimated.
- The biggest difference between estimates and actual usage is in the print sector. Here, the professionals are off by 35 percentage points (newspapers) and 39 percentage points (magazines). Translated to the total population, they thus underestimate 2.6 million users. For radio, the figure is 25 percentage points or 1.7 million users, and for TV, 18 percentage points or 1.1 million.
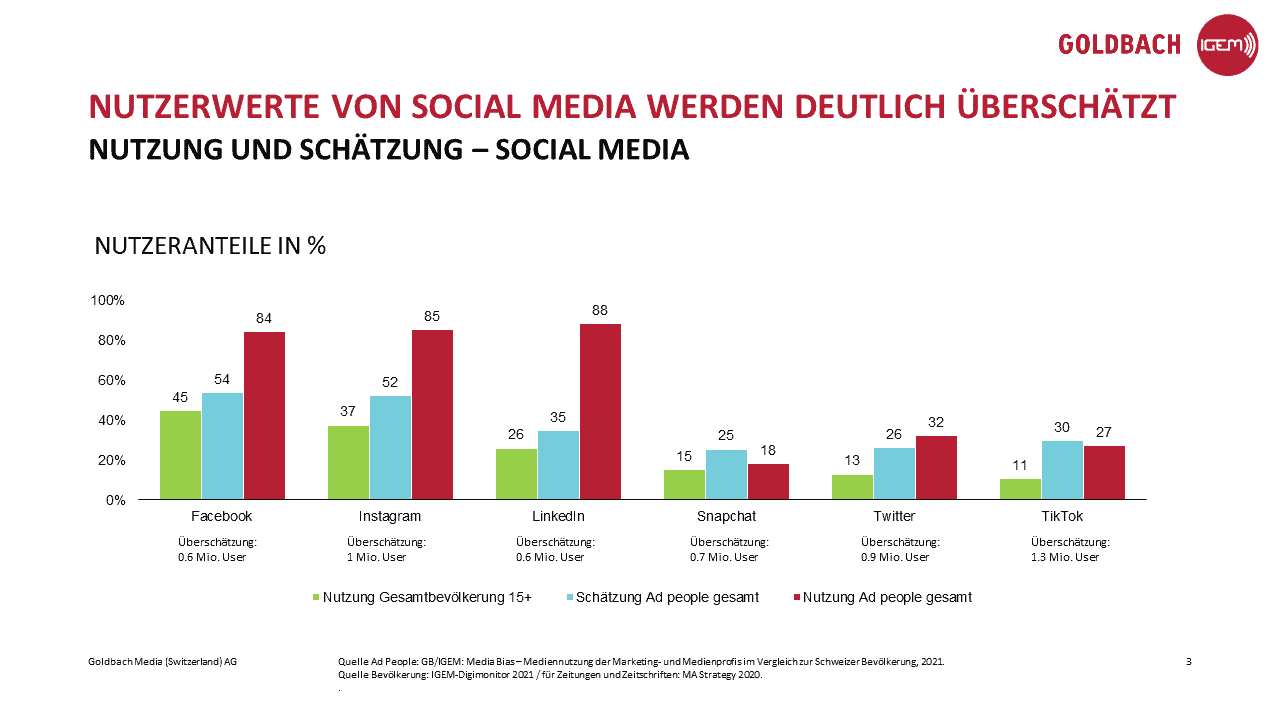
- For the newer media offerings, especially social media platforms, it is just the opposite. Here, professionals overestimate effective usage: TikTok by 19 percentage points (1.3 million users), Instagram by 15 percentage points (1 million users) and LinkedIn by 9 percentage points (around 600,000 users).

Ad people use significantly more media than the Swiss population as a whole. Classic media continue to be used heavily overall. However, ad people use these media less frequently than the general population.
- Classic media such as print (newspapers and magazines), TV and radio are used very heavily by both groups (ad people & total population). The majority of users of these media are far ahead of newer media offerings.
- 94% of both groups use TV at least occasionally. However, in the general population, the frequency of use (65% daily use) is significantly higher than among Ad People (42%). Ad People, on the other hand, use time-shifted TV more (85% at least occasional use) than the general population (72%).
- At least occasional radio use is again at a similar level in the total population (91%) as well as among ad people (89%). However, the frequency among ad people is also significantly lower (45% daily use) than among the total population (62%).
- 100% of Ad People use the Internet daily, compared to 83% for the total population.
- The clearest user differences are in print: Newspapers and magazines achieve significantly higher user shares in the total population (newspapers: 75%, magazines: 77%) than among ad people (newspapers: 38%, magazines: 48%).

Ad People use newer media offerings and technologies significantly more than the general population.
- Among the total population and the ad people, classic radio has significantly higher user shares than music streaming services. However, the latter are used at least occasionally to a much greater extent by the ad people than by the total population: 35% of the total population use YouTube Music at least occasionally, while the figure for Spotify is 33%. Among ad people, significantly more use Spotify (75%) and YouTube Music (48%).
- The picture is the same for video streaming services: At least occasional use of YouTube is 68% among the total population, 93% among ad people. The difference is even greater for Netflix: total population: 42%, ad people: 81%. In the area of moving images, however, the traditional medium of TV also has a higher user share among ad people than streaming services.
- Ad people make very heavy use of social media platforms. For virtually all channels, they have higher values than the overall population for at least occasional use: LinkedIn (Ad People: 88%, Total Population: 26%); Instagram (85% / 37%); Facebook (84% / 45%); Pinterest (43% / 23%). Twitter, Tiktok and Snapchat also have higher user values among Ad People.
- Ad People use messenger services slightly more than the overall population. The main messenger service is WhatsApp (at least occasional use by ad people: 98%, total population: 84%). Alternative messenger services such as Telegram, Signal and Threema achieve user values of just under 20% among ad people.
- In terms of video conferencing tools, it is also evident that a significantly larger proportion of Ad People use these tools: Microsoft Teams (Ad People: 89%, Total Population: 37%), Zoom (75% / 39%) and Google Meet (52% / 10%).
- While the smartwatch (12%) and smart speaker (4%) are hardly used in the overall population, 29% of Ad People use a smartwatch and 11% use a smart speaker.